Sunday, January 19, 2020
Please
find below our latest Weekly Trend Update Report covering major
asset classes and currencies.
Have
a nice week end.
Marc
Bentin
Bentinpartner GmbH
|
Global Chartbook PDF |
Trend
Status Update
This year is starting like 2019
ended, in “melt up” mode. Bullish sentiment and possible excess was evidenced
last week by the lowest mutual funds’ cash allocation on record, a five-year
low in the US put-to-call ratio, NAAIM, AAII, Hulbert Sentiment, RYDEX
bull-to-bear ratio standing at their highest in history, speculative call
buying volume as a percentage of total NYSE volume also at its highest in
history, not to speak about the parabolic formation taking place in most of the Fangs where the FOMO (fear of missing out) expressed
itself best. Google joined the 1 trillion market cap on Thursday. On the other
side of the coin, “old economy” Alcoa stumbled 12% on weaker than expected
results and despite the company saying the order book for 2020 is
improving.
The IIF reported a further (some would argue parabolic) rise global debt
to 322% of World GDP affecting household, corporate, government and financials across
both the DM and EM space, “spurred by low interest rates and loose financial
conditions”. US Economic data came out mostly stronger last week with retail
sales ex autos reporting a 0.7% monthly increase (climbing for the third
straight month) and December new home sales surging to a 13 year high on
Friday, up 16.9% annualized. It is not only low rates that are boosting sales
or a strong US job market (new openings dropped rather sharply last Friday however
following up to a weaker job report the week before), but looser mortgage
underwriting standards that eased considerably over the past two years. The
largest US originators are now offering jumbo mortgage loans of USD1mn with
only 10% down payment. Those who can bring a 30% down payment are able to
receive up to USD3mn in loans. No problem except that those loans could be the
prelude to jumbo problems later on…when things normalize which they may never
do, the more these excesses are allowed to accumulate. JPMorgan took note of
this state of affairs (excess positioning and optimism) last week already in
its Global Liquidity report and referred again over the week end to a “yellow
warning” signal but none of this seems actionable on a contrarian basis, just
yet, even if it suggests speculative excess behaviour fostered by the lack of
an immediate catalyst for a possible reversal. Talking about JPMorgan, the
company reported its most profitable year ever last week, propelled by consumer
borrowing and a rebound in investment banking (during the Sino/US phase I deal
signing ceremony at the White House on Wednesday, D. Trump asked JPM CEO J. Dimon to thank him for it). December industrial production data showed a
downturn, but that was largely blamed on a 5.6% decrease in utilities due to
the unseasonably warm winter weather.
Catalysts (for a setback) could later on come from Democrats’ Primaries
in February-March or Central Banks recognizing more frequently and openly (as Dallas
Fed President Kaplan hinted on Thursday) that their action now likely support and
fuels speculative excesses. The Fed is expected to trim its balance sheet,
albeit only slightly (after increasing it by USD400bn via repo’s) in the coming
months, but remains until now and for the most part still “anesthetized” or
“hypnotized”, held at gunpoint from Trump’s Twitter feed. Other major Central
Banks are in wait and see mode. As for geopolitical risks, nobody seems to care
about them and in particular not since Iran shot itself in the foot with the accidental
downing of a Ukrainian airliner.
Central Banks likely hold the key to support or diffuse the “melt up”
phase observed in financial markets today and in particular the excessive
leverage held by Hedge Funds.
Perhaps the best way to assess whether Central Banks do play a role in
what is happening is to look at how and why asset managers delivered their
performance last year. Asset managers were split in four categories:
·
The first one
was afraid of a repeat of 2018, of the inversion of the curve, of the collapse
in world trade and the likely upcoming recession. Those played it safe and
bought bonds and corporate bonds all the way to negative territory … They made
a killing last year and that is where the flows went last year for the most
part.
·
The second
category believed that Trump holds the holy grail of economic and central bank management
(and of stock markets manipulation), hanging over Trump’s highly manipulative Tweeter
feed. They somehow played it safe
(holding their nose and eyes closed), going and staying overweighed stocks…They
made a killing last year as well (or at least recovered their loss from 2018).
·
The third category
got really nervous about the risks of monetary disorder that might result from
massive “non-QE” liquidity injections. They played it safe as well, buying gold
and precious metals… They also made a killing last year.
·
The fourth
category was evenly split, weighing probabilities for the three scenarios above.
They bought bonds, stocks and precious metals, leveraging these three bets,
encouraged by historically low volatilities and presupposed diversification
benefits. Those included “risk parity” portfolios. And they made a killing “cubed”.
The very fact that all asset classes delivered an excellent performance all by themselves last year in
the aftermath of the Fed historic pivot (from tightening to easing in March),
whilst restarting “non-QE” balance sheet expansion, was a textbook illustration
of what monetary policy stimulus can do when pushed towards extremes; lifting
all boats indiscriminately. Their purchase brought bonds in the silly land of
negative yields, coupled to artificially compressed credit spreads, while stock
valuation rose well above their 30 year historic average, kickstarting a wave
of central bank buying in the metals markets, from those fearful of a
rekindling of inflation and those interested to de-anchor their economy away
from an increasingly weaponized USD.
Asking the question of the role of Central banks in what is happening is
answering it and it is up to them to decide what is next, considering that
animal spirits are wild and sometimes need to be tamed also to fulfil the
important Central bank responsibility of fostering long-term stability and
sustainability (inconsistent with melt up conditions).
The ongoing runaway rally in stocks is leading to a concentration of
wealth never seen before with 1% of the population now controlling 50% of the US equity market cap and 10% of the population controlling 90% of it
while the vast majority of the population held on to cash deposits yielding mediocre
to negative returns (they were also net sellers of stocks last year). Those holding
the short straw are the same ones that will suffer if/when pension funds
obligations start to be defaulted upon for lack of yield. In that case, the
only solution will be in the universal salary (and pension), printed out of
thin air… Structural issues should also be tackled like taming hedge funds
leverage (irrespective of the level of interest rates!), unless that is deemed inconsistent with a
smooth funding of a ballooning US fiscal deficit at the same time as foreign
appetite for US treasuries is dwindling. Forbidding share buybacks (which are
taking the blood out of public markets while increasing credit risk in the
system) is another measure that should be worth considering as a “non-monetary
policy” related decision as the maintenance of zero or sub zero rates has
ingrained in its DNA the forced evaporation of public markets (or its substitution
by toxic non-earning producing assets like most of the Unicorns) to the benefits
of more opaque private markets, only accessible to the happy fews.
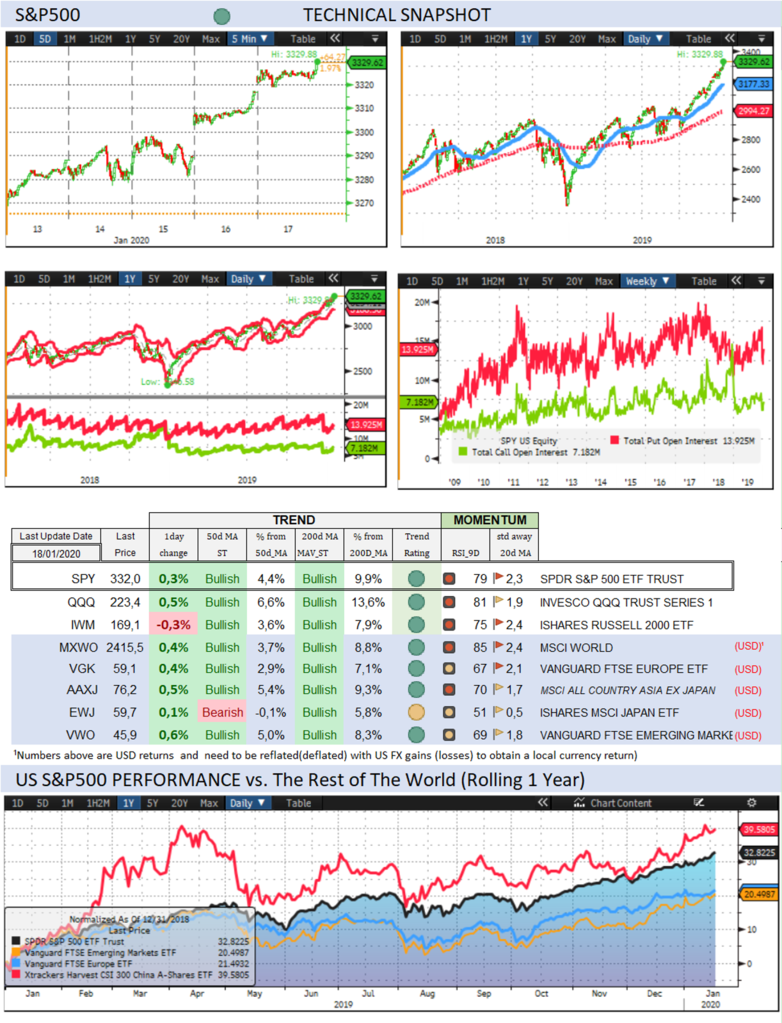
The Eurostoxx50 gained 0,4% (1,9%), underperforming the S&P500 by
-1,5% although it did manage to close some of last week’s underperformance on
Friday on hopes that Trump will not follow through with a trade tariff
escalation with Europe that seems to have caved in to Trump’s blackmail regarding Iran. Or else it was because of Germany’s decision to
roll over an additional EUR30bn on infrastructure and climate change
investments, slowly opening the purse strings for useful purposes. VGK (VANGUARD FTSE EUROPE ETF) gained 1,5% (0,8%, Z-score 2,1).
Diversified EM equities (VWO) gained 1,4% (3,2%), underperforming the
S&P500 by -0,5%. RSX (VANECK RUSSIA ETF) rallied 2,2% (6,4%). ASHR
(XTRACKERS HARVEST CSI 300 CH) gained 1,1% (3,3%).
The Dollar DXY Index (UUP) rose 0,4% (1,3%) while the MSCI EM currency index
(measuring the performance of EM currencies vs. the USD) gained 0,1% (0,3%).
10Y US Treasuries were unchanged (-10bps) to 1,82%. 10Y Bunds dropped
-2bps (-3bps) to -0,22%. 10Y Italian BTPs underperformed rising 6bps (-4bps) to
1,38%, outperforming Bunds by -6bps. US consumer prices rose slightly in
December with the CPI accelerating 2.3% in 2019, the largest rise since 2011.
US High Yield (HY) Average Spread over Treasuries dropped -7bps (-16bps)
to 3,20%. US Investment Grade Average OAS dropped -3bps (1bps) to 1,02%. The rally in dubious high yield credit accelerated last week. While the amount of negatively yielding
securities declined further to a still whopping USD11.2trn (from >15trn last
year), the credit picture showed the nominal outstanding in BBB (last investment
graded bonds before switching to junk) rated debt securities kept increasing at
an accelerating pace. The credit spread between BB (best high yield) and BBB
(worst investment graded bonds) also shrank to its lowest level since 2006,
just prior to the great financial crisis. In European credit markets, EUR 5Y
Senior Financial Spread was unchanged (-1bps) to 0,51%. More than 60% of total
high yield issuance last week were corporate bonds from energy (shale) companies
with lower credit ratings.
Gold dropped -0,3% (2,6%) while Silver dropped -0,4% (1,1%). Major Gold
Mines (GDX) dropped -0,1% (-2,9%). Up 34% since Christmas and climbing as much
as 10% Friday, Palladium went parabolic as well, reflecting how raw materials in shortage
act if both the demand and supply side are price inelastic (about 85% of
palladium ends up in cars’ exhaust systems, where it helps turn toxic
pollutants into less-harmful carbon dioxide and water vapor). Platinum was on
the move last week as well.
Goldman Sachs Commodity Index dropped -0,8% (-2,1%). WTI Crude dropped
-0,8% (-4,1%).
Trend Score Card
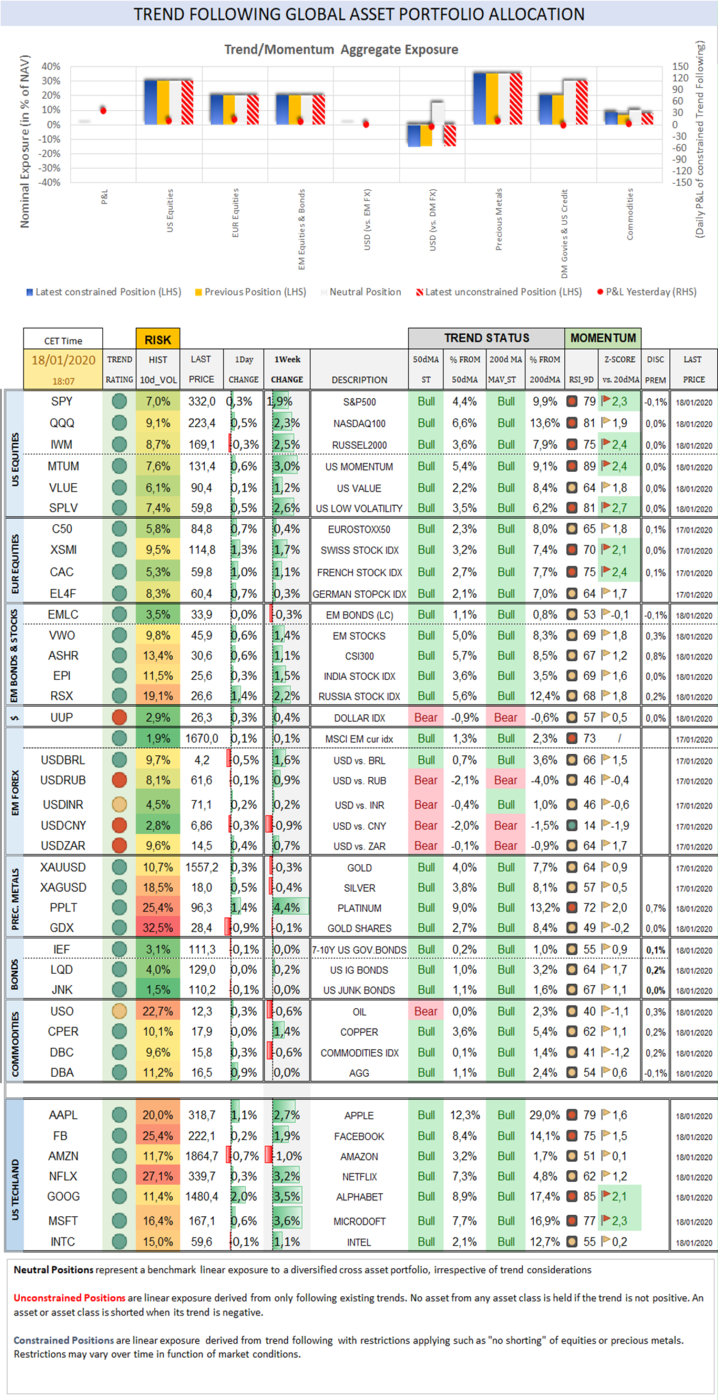
Click here for technical annotations.
US
& International Equities
Check out US and International Stocks’ Technical
Trend Status.
Sector
Trend & Momentum
Check equity sectors’ trend and performance …and when
they break out!
Fixed
Income
Check out 10Y US Treasury and Bund yields, their
trend, expected Fed rate moves and speculative positioning in 10-year Treasury
Futures.
US Recession
Risk Radar
A comprehensive list of
economic indicators to compare the current situation with previous recessions.
The
Dollar
Check out where the Dollar stands Trendwise and Breakoutwise vs. G7
and EM counterparts.
Precious Metals
Check out where precious
metals stand Trendwise
and Breakoutwise.
Get a sense of options (cumulative open interests on calls and puts) and
futures traders’ sentiment (non-commercials open positions).
Why Trend Following Matters and How It Can Help
You?
Trend following offers
guidance as to when to join and when to leave an asset class with changing
trend characteristics. A disciplined and rule-based trend following investment
approach can serve as an effective portfolio insurance technique. Our purpose,
beyond tracking economic, political and monetary developments is to assist
readers investing in global markets with a keen focus on trend formation
covering major asset classes.
To receive a Daily Trend
Status Update and round the clock market and economic instant messages, join a
free trial of our premium research.
To learn more about our premium research:
https://www.bentinpartners.ch/research
To join our free trial and choose your delivery preferences:
https://www.bentinpartners.ch/subscribe
Please visit our web site or call us at
+41615444310. We’d love to hear from you and see how we can further assist you.
Join us on Linked In
To be removed from the
list, please send us an email by clicking here, mentioning “unsubscribe”
in the title.
To ensure that our emails
reach your inbox and not your spam folder, please consider adding
Marc.Bentin@BentinPartner.ch, Marc.Bentin@BentinPartners.ch and our alternate
address Bentinpartner@gmail.com to your safe address book. If you are using
Microsoft Outlook, simply right click on our email address, choose "add to
Outlook contacts" and then "save".
Important Disclaimer
© Copyright by BentinPartner llc.
This communication is provided for information purposes only and for the
recipient's sole use. Please do not forward it without prior authorization. It
is not intended as a recommendation, an offer or solicitation for the purchase
or sale of any security or underlying asset referenced herein or investment
advice. Investors should seek financial advice regarding the suitability of any
investment strategy based on their objectives, financial situation, investment
horizon and particular needs. This report does not include information tailored
to any particular investor. It has been prepared without any regard to the
specific investment objectives, financial situation or particular needs of any
person who receives this report. Accordingly, the opinions discussed in
this Report may not be suitable for all investors. You should not consider any
of the content in this report as legal, tax or financial advice. The data and
analysis contained herein are provided "as is" and without warranty
of any kind. BentinPartner llc,
its employees, or any third party shall not have any liability for any loss
sustained by anyone who has relied on the information contained in any
publication published by BentinPartner llc. The content and views expressed in this report
represents the opinions of Marc Bentin and should not be construed as
guarantee of performance with respect to any referenced sector. We remind you
that past performance is not necessarily indicative of future
results. Although BentinPartner llc believes the information and content included in
this report have been obtained from sources considered reliable,
no representation or warranty, express or implied, is provided in relation to
the accuracy, completeness or reliability of such information. This Report is
also not intended to be a complete statement or summary of the industries,
markets or developments referred to in the Report.
#fx #forex
#investing #markets #riskmanagement #bankingindustry #finances #money #traders #quants