TSE All-Share Index
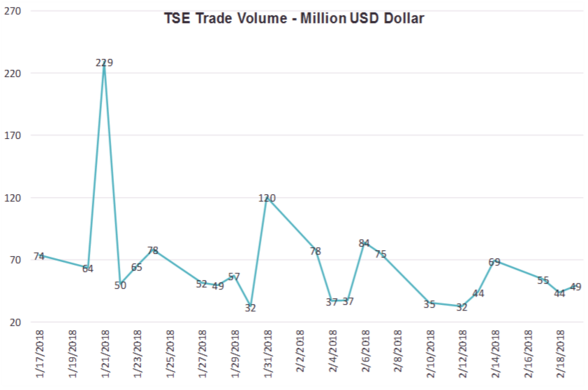
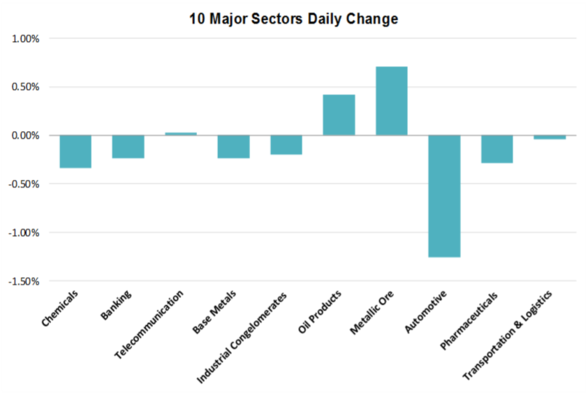
The Tehran Stock Exchange All-Share Index slipped 0.15% to close at 98,148. Today’s top performing sector was Paper Products (+3.03%), while Other Financial Services (-2.33%) was the weakest. Automotive (-1.26%) posted the highest trading volume among sectors with IRR 192 billion (approx. USD 4.1 million) in trades. Top negative movers of the All-Share Index were Persian Gulf Petrochemical Industries Co. (PKLJ -0.79%), Tamin Petroleum & Petrochemical Industries Co. (PTAP -1.32%) and MAPNA Group (MAPN -1.91%). Mines & Metals Development Investment Co. (MADN +2.22%) was the most traded stock by value with volume of IRR 83 billion (approx. USD 1.8 million). In total 933 million securities were exchanged on the TSE for IRR 2,254 billion (approx. USD 49 million), up 10.9% from the previous trading session.
TSE30 Index
The TSE30 index of the thirty largest companies by market capitalization closed down 0.23% at 4,348. The majority of constituents dropped, with Iran Khodro (IKCO -2.02%) and MAPNA Group (MAPN -1.91%) leading fallers. Mines & Metals Development Investment Co. (MADN +2.22%) was the biggest gainer of the index. The total traded value of the top 30s increased 13.3% to IRR 434 billion (approx. USD 9.4 million).
Highlights
The Tehran Stock Exchange will be closed on Tuesday, February 20, due to a public holiday. |
|
Market Information
|
Index |
|
Value |
Unit Change |
% Change |
|
TSE All-Share Index |
98,148 |
-152 |
|
0.15 |
|
TSE30 Index |
|
4,348 |
-10 |
|
0.23 |
|
Traded Value (USD million) |
49 |
5 |
|
10.9 |
|
Volume (million shares) |
933 |
-65 |
|
6.48 |
|
|
|
|
|
|
|
|
Top Influencers |
|
Close ($Cents) |
% Change |
|
Persian Gulf Petrochemical Ind. Co. |
11.9 |
|
0.79 |
|
Tamin Petroleum & Petrochem. Inv. Co. |
3.4 |
|
1.32 |
|
MAPNA Group |
15.3 |
|
1.91 |
|
Mines and Metals Dev. Inv. Co. |
4.0 |
|
2.22 |
|
|
|
|
|
|
|
|
Top Gainers |
|
Close ($Cents) |
|
% Change |
|
Tosee Melli Group Investment Co. |
2.5 |
|
7.32 |
|
Iran Carton Co. |
13.3 |
|
5.35 |
|
Abadan Petrochemical Co. |
5.7 |
` |
4.97 |
|
Mehvar Sazan Iran Khodro Co. |
4.7 |
|
4.96 |
|
Sectors with Highest Daily Change |
Value |
|
% Change |
|
Paper Products |
11,284 |
|
3.03 |
|
Automotive |
16,688 |
|
1.26 |
|
Engineering Services |
688 |
|
1.91 |
|
Other Financials |
2,173 |
|
2.33 |
|
|
|
|
|
|
|
|
Highest Daily Traded |
|
Volume (M Shares) |
Value ($ M) |
|
Mines and Metals Dev. Inv. Co. |
45 |
|
1.8 |
|
Bandar Abbas Oil Refining Co. |
10 |
|
1.6 |
|
Behshahr Industrial Dev. Corp. |
13 |
|
1.0 |
|
Saipa Diesel Co. |
46 |
|
0.9 |
|
|
|
|
|
|
|
|
FX Daily Change |
|
IRR |
|
% Change |
|
USD Official |
|
37,150 |
|
0.05 |
|
USD Free Market |
|
45,938 |
|
1.01 |
|
EUR Official |
|
46,136 |
|
0.10 |
|
EUR Free Market |
|
56,184 |
|
2.80 | |
Blue Chips Ticker’s Update
Closed Tickers: -
Re-Opened Tickers: -
IPO: - |
|
**All figures in USD are converted from IRR at the free market rate
Turquoise Partners - Firouzeh Asia Brokerage
All Rights Reserved - 2018
|
|
|
|