Sunday, January 12, 2020
Please
find below our latest Weekly Trend Update Report covering major
asset classes and currencies.
Have
a nice start of the week.
Marc
Bentin
Bentinpartner GmbH
Trend
Status Update
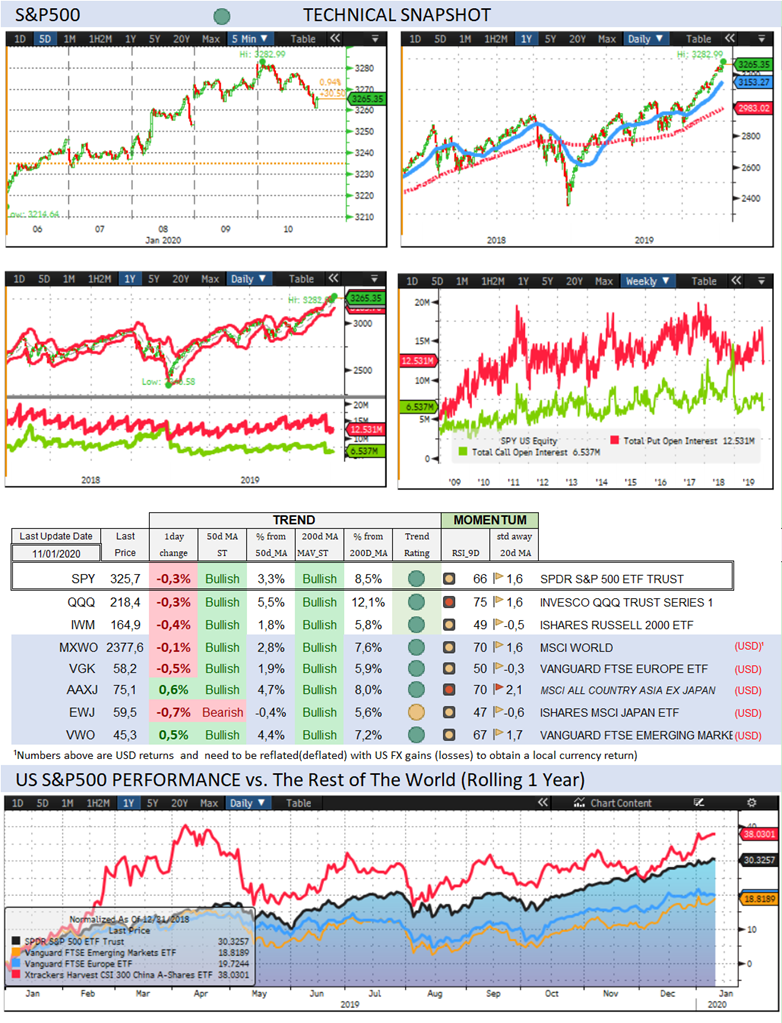
Over the past
week, the S&P500 gained 1,0% (1,2% YTD) while the Nasdaq100 gained 2,0%
(2,7% YTD). The US small cap index dropped -0,1% (-0,5% YTD). Soft payrolls data offered a reason for a mild correction
ahead of the week end after US benchmarks hit fresh records earlier last week.
The Eurostoxx50 gained 0,6% (1,5%), underperforming the S&P500
by-0,4%. Investors flocked into Fangs again with most of them rallying strongly on the
week.
AAPL rallied 4,3% (5,7%). FB added
4,5% (6,2%). LYFT rallied 6,6% (7,1%). AMZN gained 0,4% (1,9%). NFLX gained
1,0% (1,7%). GOOG rallied
5,1% (6,9%, Z-score 2,4). The CEO of GOOG just received a strong
incentive in getting his stock price higher with the SEC approved that his
performance bonus would be tied this year and next not on the share price itself
but on its outperformance vs. the S&&P500. The concentration of performance
of US indices on just a few names is at its highest since the late 1990’s with
the top 5 companies of the S&P500 (1%) making up 18% of the total market
cap of the index. The percentage of US listed companies losing money over the
past 12 months is now also close to 40%, its highest level since the
concentration peak of 1999 and a situation that could only get worse in a
recessionary scenario. At the same time,
the issuance of high yield issuance is red hot and even stronger than last
year. The profit season is kicking off this week and should show some
improvement vs. last quarter but it is not a stretch of the imagination to
consider that today’s situation is …stretched and reminiscent of historic
extremes. In the meantime, and probably for that reason, although major US
indices returned more than 30% last year, Ray Dalio reported
his first annual loss since 2000 with its Pure Alpha fund returning -0.5% in
2019. Crispin Odey, another famed Hedge Fund manager
finished down 10% last year.
Last week, more emails were made public from Boeing personnel who qualified
the 737 Max as a plane “designed by clowns and certified by Monkies”,
which in a colourful fashion further compromised the future of this airplane.
The company announced last week that it would stop the production of the plane generating
the largest part of its income as of next month and start firing employees.
Diversified EM equities (VWO) gained 1,2% (1,8%), supported by continued
strong inflows in China, CNY breaking higher and the CSI300 trading in positive
trend mode and near the top of its Bollinger band (see China’s snapshot). Noticeably at a time when many investors fret
over excess leverage in China, China’s CDS is now only 30bps, a fresh low and
half the level where it was at the same time last year. XHB (SPDR S&P HOMEBUILDERS ETF) gained 1,6% (1,4%, Z-score 2,0).,
supported by a further decline in US mortgage rates.
The Dollar DXY Index (UUP) measuring the USD performance vs. other G7
currencies gained 0,5% (1,0%) while the MSCI EM currency index (measuring the
performance of EM currencies vs. the USD) gained 0,5% (0,2%). We continue to
expect more currency instability this year and were hard pressed, like many observers,
to see the way the dollar (and to a lesser extent the yen) reacted to the spike
in risk off last week (that briefly propelled gold above USD1600) in the aftermath
of the US/Iranian spat. This, coupled to ongoing strength in EM currencies and a
possible further easing by the Fed, coupled to fiscal slippage and a diminishing
appetite of foreigners for US Treasuries, could take its toll on the USD throughout
the year.
10Y US Treasuries dropped 3bps (-10bps) to 1,82%. 10Y Bunds climbed 8bps
(-1bps) to -0,20%. 10Y Italian BTPs dropped -3bps (-9bps) to 1,32%, out-performing
Bunds by -4bps. US High Yield (HY) Average Spread over Treasuries dropped -8bps
(-9bps) to 3,27%. US Investment Grade Average OAS was unchanged (4bps) to
1,05%. Former Fed Chair B. Bernanke pushed back last week the notion that
central banks have lost their influence on the economy and may be out of ammunition.
Former Treasury Secretary L. Summers dismissed Bernanke’s optimism and referred
to the current situation as being the “last hurrah for central bankers” as he
argued that monetary policy will not be able “to do it the next time”, given
that in past recessions, the Fed usually cut by 5% whilst interest rates are
currently below 2%. “We’ll have to rely on putting money in people’s pockets”,
he said as he also discarded the possibility of putting in place semi-automatic
stabilisers that would bypass Congress. Economic data published last week were
mostly subdued in the US, Germany and Japan. Prior to the weaker US jobs
report, Japan services sector saw its deepest contraction in more than three
years in December (Services PMI dropped to 49.3 from 50.3 in November). German
industrial orders fell unexpectedly on weak foreign demand, confirming the
manufacturing slump. The World Bank also trimmed its global growth forecast for
2019 and 2020 due to a slower than expected recovery in trade and investment
despite a cooling in trade tensions. At the same time, in Europe inflation
across the eurozone rose to a six-month high of 1.3% (from the previous month
at 1%) even before the recent jump in oil prices, still below the ECB target
goal of just below 2%.
In European credit markets, EUR 5Y Senior Financial Spread dropped -3bps
(-1bps, Z-score -2,1) to 0,50%.
Gold gained 0,7% (3,0%) while Silver gained 0,3% (1,5%). Major Gold
Mines (GDX) sold off by -2,5% (-2,8%). The correlation analysis between Gold
and stocks continue to show the attractive diversification (hedging) potential of gold vs. risky assets despite cross asset correlation
recently increasing above their 5year, 1year and 1 month averages.
Goldman Sachs Commodity Index sold off by -3,2% (-1,4%). Gold rallied
past USD1600 on geopolitical tensions before ebbing back following the
accidental shooting down of a passenger jet during the Iranian shelling operation
of the US military base in Iraq. WTI
Crude sold off by -6,4% (-3,3%). NGA (NATURAL GAS FUTR Feb20) rallied 3,4% (0,6%).
Over the week end….
Iran confirmed over the week end the accidental shooting down of a Ukrainian
civil aircraft that took 140 lives, neutralizing by the same count, and at
least for a while, the potential for more Iranian (and US!) military escalation.
This week will witness a (theatrical?) signature of the phase I China/Us trade
deal…and if that does not hold the market up, there will likely be Presidential
tweets about a Phase 2 deal progress. This is also helping Chinese markets.
D. Trump took it to Tweeter in Arabic overnight, saying that “sanctions
and protests have put Iran under great pressure and force them to negotiate.” Perhaps,
his language skills will appeal to
Iranians.
Trend Score Card
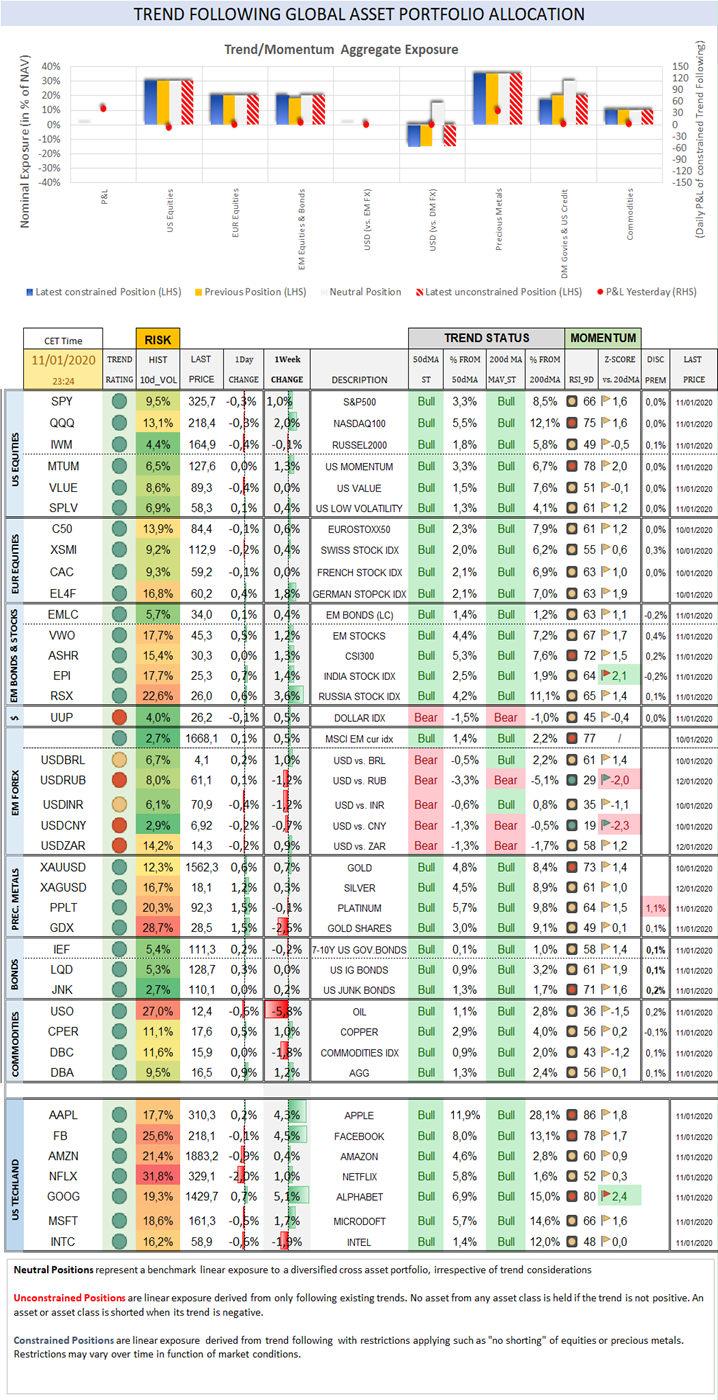
Click here for technical annotations.
US
& International Equities
Check out US and International Stocks’ Technical
Trend Status.
Sector
Trend & Momentum (revised)
Check out equity sectors’ trend and performance
…and when they break out!
Fixed
Income
Check out 10Y US Treasury and Bund yields, their
trend, expected Fed rate moves and speculative positioning in 10-year Treasury
Futures.
US Recession
Risk Radar
A comprehensive list of
economic indicators to compare the current situation with previous recessions.
The
Dollar
Check out where the Dollar stands Trendwise and Breakoutwise vs.
G7 and EM counterparts.
Precious Metals
Check out where precious
metals stand Trendwise
and Breakoutwise.
Get a sense of options (cumulative open interests on calls and puts) and
futures traders’ sentiment (non-commercials open positions).
Why Trend Following Matters and How It Can Help
You?
The last months of 2018
illustrated how fast and furious markets can fall. Trend following offers
guidance as to when to join and when to leave an asset class with changing
trend characteristics. A disciplined and rule-based trend following investment
approach can serve as an effective portfolio insurance technique. Our purpose,
beyond tracking economic, political and monetary developments is to assist
readers investing in global markets with a keen focus on trend formation
covering all important asset classes.
To receive a Daily Trend
Status Update and much more, join a
free trial of our premium research.
To learn more about our premium research:
https://www.bentinpartners.ch/research
Feel free to join our free trial and choose your
delivery preferences:
https://www.bentinpartners.ch/subscribe
Please visit our web site or call us at
+41615444310. We’d love to hear from you and see how we can further assist you.
Join us on Linked In
To be removed from the
list, please send us an email by clicking here, mentioning “unsubscribe”
in the title.
To ensure that our emails
reach your inbox and not your spam folder, please consider adding
Marc.Bentin@BentinPartner.ch, Marc.Bentin@BentinPartners.ch and our alternate
address Bentinpartner@gmail.com to your safe address book. If you are using
Microsoft Outlook, simply right click on our email address, choose "add to
Outlook contacts" and then "save".
Important Disclaimer
© Copyright by BentinPartner llc.
This communication is provided for information purposes only and for the
recipient's sole use. Please do not forward it without prior authorization. It
is not intended as a recommendation, an offer or solicitation for the purchase
or sale of any security or underlying asset referenced herein or investment
advice. Investors should seek financial advice regarding the suitability of any
investment strategy based on their objectives, financial situation, investment
horizon and particular needs. This report does not include information tailored
to any particular investor. It has been prepared without any regard to the
specific investment objectives, financial situation or particular needs of any
person who receives this report. Accordingly, the opinions discussed in
this Report may not be suitable for all investors. You should not consider any
of the content in this report as legal, tax or financial advice. The data and
analysis contained herein are provided "as is" and without warranty
of any kind. BentinPartner llc,
its employees, or any third party shall not have any liability for any loss
sustained by anyone who has relied on the information contained in any
publication published by BentinPartner llc. The content and views expressed in this report
represents the opinions of Marc Bentin and should not be construed as
guarantee of performance with respect to any referenced sector. We remind you
that past performance is not necessarily indicative of future
results. Although BentinPartner llc believes the information and content included in
this report have been obtained from sources considered reliable,
no representation or warranty, express or implied, is provided in relation to
the accuracy, completeness or reliability of such information. This Report is
also not intended to be a complete statement or summary of the industries,
markets or developments referred to in the Report.
#fx #forex
#investing #markets #riskmanagement #bankingindustry #finances #money #traders #quants