TSE All-Share Index
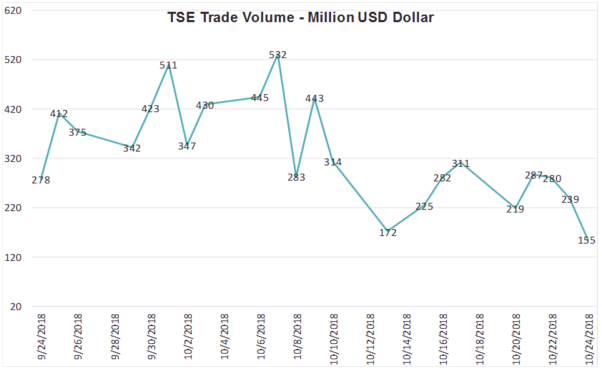
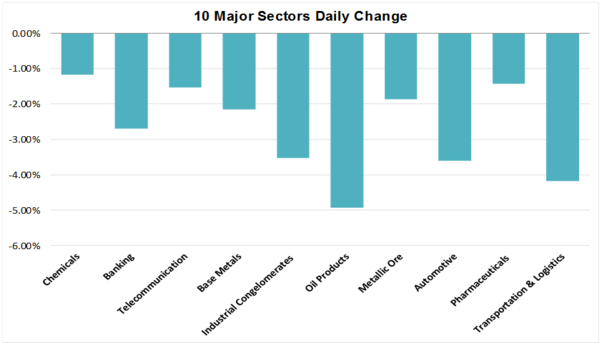
The Tehran Stock Exchange All-Share Index fell 2.30% to close at 181,060. Metallic Products (+1.39%) led gainers among sectors, while the biggest faller was Oil Products (-4.93%) which was also the most traded sector with volume of IRR 1,434 billion (approx. USD XX million). Esfahan Oil Refining Co. (PNES -7.77%) Persian Gulf Petrochemical Ind. Co. (PKLJ +3.34%) and Tehran Oil Refining Co. (PTEH -7.27%) were the main movers of the All-Share Index. Esfahan Oil Refining Co. (PNES -7.77%) was the most traded stock with IRR 621 billion (approx. USD 14 million) of shares exchanged. The total traded value of the market reached IRR 6,511 billion (approx. USD155 million), down 35% from the previous trading session.
TSE30 Index
The TSE30 index of the 30 largest companies by market capitalization closed at 9,058 for a loss of 2.44%. The biggest riser was Persian Gulf Petrochemical Co. (PKLJ +3.34%) while Esfahan Oil Refining Co. (PNES -7.77%) dropped the most. Total traded value of the top 30 stocks reached IRR 3,099 billion (approx. USD 73 million), down 28% from the previous trading session. |
|
Market Information
|
Index |
|
Value |
Unit Change |
% Change |
|
TSE All-Share Index |
181,060 |
-4,259 |
|
2.30 |
|
TSE30 Index |
|
9,058 |
-226 |
|
2.44 |
|
Traded Value (USD million) |
155 |
-84 |
|
35.2 |
|
Volume (million shares) |
1,822 |
-935 |
|
33.9 |
|
|
|
|
|
|
|
|
Top Influencers |
|
Close ($Cents) |
% Change |
|
Esfahan Oil Refining Co. |
23.8 |
|
7.77 |
|
Persian Gulf Petrochemical Ind. Co. |
11.6 |
|
3.34 |
|
Tehran Oil Refining Co. |
16.8 |
|
7.27 |
|
Tamin Petroleum & Petrochem. Ind. Co. |
6.1 |
|
4.70 |
|
|
|
|
|
|
|
|
Top Gainers |
|
Close ($Cents) |
|
% Change |
|
Pars Electric manufacturing Corporation |
12.7 |
|
8.01 |
|
Sepahan Industrial Group Co. |
12.3 |
|
4.99 |
|
Pars Ceram co. |
14.0 |
|
4.98 |
|
Pars Agro. Industries Co. |
10.2 |
|
4.98 |
|
Sectors with Highest Daily Change |
Value |
|
% Change |
|
Transportation & Logistics |
4,960 |
|
4.18 |
|
Paper Products |
13,261 |
|
4.19 |
|
Engineering Services |
1,161 |
|
4.70 |
|
Oil Products |
858,029 |
|
4.93 |
|
|
|
|
|
|
|
|
Highest Daily Traded |
|
Volume (M Shares) |
Value ($ M) |
|
Esfahan Oil Refining Co. |
62 |
|
14.8 |
|
Mellat Bank |
155 |
|
9.3 |
|
Tamin Petroleum & Petrochem. Ind. Co. |
108 |
|
6.7 |
|
Sepahan Oil Co. |
7 |
|
6.3 |
|
|
|
|
|
|
|
|
FX Daily Change |
|
IRR |
|
% Change |
|
USD |
|
42,000 |
|
0.00 |
|
EUR |
|
48,183 |
|
0.15 | |
Blue Chips Ticker’s Update
Closed Tickers:
Re-Opened Tickers: Tabril Oil Refining Co. (PNTB),
IPO: - |
|
**All figures in USD are converted from IRR at the free market rate
Turquoise Partners - Firouzeh Asia Brokerage
All Rights Reserved - 2018
|
|
|
|