Main Topics
-
Less volatility on Tehran Stock Exchange with end of Ramadan holidays
-
Iran Fara Bourse gains 0.7% despite less trades
-
Tehran quarterly home sales tick up 0.9%
Tehran Stock Exchange
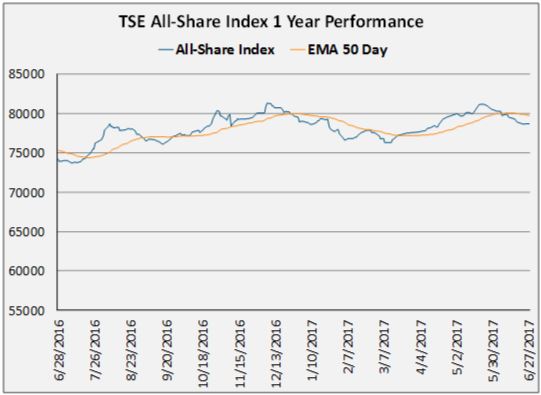
The
Tehran Stock Exchange All-Share Index ended barely changed over a
holiday-shortened week, closing down 0.04% at 78,704. There was no trading on
Monday and Tuesday for end of Ramadan holidays. Gainers among major sectors
were led by Construction (+2.1%), boosted by Sakht Ajand (SAJN +12.6%) and
Abadgaran Iran Welfare & Tourism Complex (ABAD +12.0%). However, the
largest construction companies were little changed. The biggest faller of the
week was Engineering Services (-2.8%), weighed down by MAPNA Group (MAPN
-2.9%). Despite recent price increases of metal products and iron ore on
global markets, commodity shares have not shown significant changes on the
TSE so far. Still Esfahan Mobarakeh Steel Co. (FOLD +4.4%) pushed up the Base
Metal sector (+1.7%) with better than expected reports for the financial year
ending March 19, 2017. The company released its unaudited reports showing net
profits were 44% higher than its last projection at IRR 17.8 trillion
(approx. USD 474 million). The company said the increase was due to higher
sales volumes and productivity.
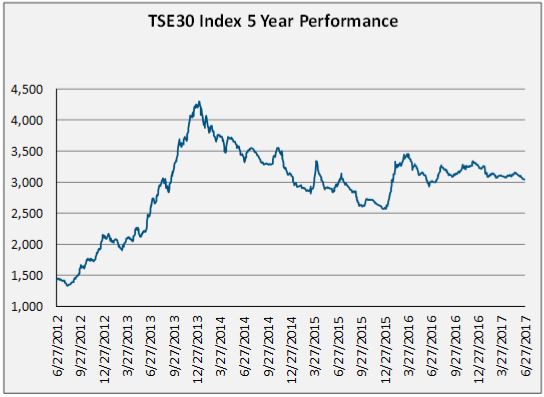
The
TSE30 index of the thirty largest companies by market capitalization closed
down 0.1% for the week at 3,047. Esfahan Mobarakeh Steel Co. (FOLD +4.4%) led
gainers, while Mellat Bank (BMLT -3.3%) dropped the most.
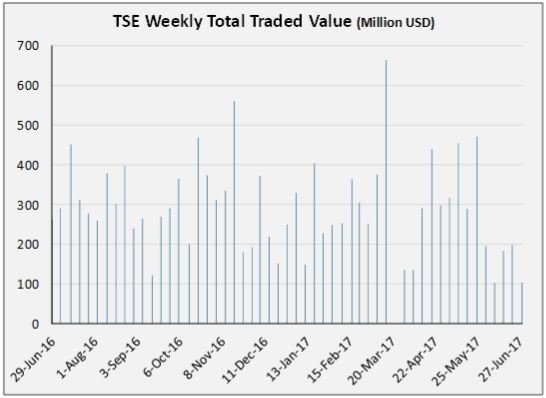
This
week the Average Daily Trade Volume (ADTV) dropped 12% to USD 34 million.
Stocks most traded by value were led by Sakht Ajand (SAJN +12.6%), Silica
Sand Mfg. Co. (TAMI -4.1%) and Insurance Industry Investment Co. (BIME
+11.1%) with USD 3.8 million, USD 2.2 million and USD 1.9 million
respectively.
Iran Fara Bourse
The
overall index of the Iran Fara Bourse gained 0.7% to close at 910, while its
ADTV slumped 50% to USD 30 million. Despite fewer trades on the IFB, equities
remained the most traded instrument with a total volume of IRR 2,443 billion
(approx. USD 65 million).
Foreign Exchange Market
The
Iranian rial eased against major currencies over the week. The official rate
of the US dollar was left almost unchanged by the Central Bank of Iran at IRR
32,489, down 0.01% from a week ago. But on the free market, the dollar gained
0.4% to IRR 37,586. The CBI added 2.1% to the official rate of the euro at
IRR 37,057, while its free market rate rose 0.9% to IRR 42,261. The British
pound’s official rate was set at IRR 42,081, up 2.2% for the week, while
sterling gained 1.7% on the free market to IRR 48,900.
Economic Developments
Iran’s
annual inflation rate has eased, according to the latest Consumer Price Index
figures released by the CBI. In the month to June 21, 2017, the year on year
inflation fell to 11.0% from 11.8% in the previous month. The CPI
gained 0.5% over the third month of the Iranian calendar year, compared to a
0.2% gain in May. On a yearly basis, the highest inflation rates were posted
by Medical Care (+15.3%) and Foods & Beverages (+15.2%) while Tobacco
(0.6%) saw the lowest price rises. The biggest riser in the latest month was
Household Goods & Services (+1.1%) while Communication saw prices fall
0.2% from May.
The
CBI reported separately that home sales in Tehran slipped in the month ending
June 21 to a total of 15,362 units. This was 6.2% down on the previous month
and 0.8% lower than the same month a year ago. Despite this weaker monthly
performance, home sales over the first quarter of the current Iranian year
were still 0.9% higher than the same period last year and 7.2% up on two
years ago, at 37,120 units. The average price of one square meter of sold
residential space in the latest month gained 0.7% from May to USD 1,214,
making a gain of 5.4% over 12 months. The average price over the first
quarter was USD 1,194, up 4.9% from the first quarter last year and 7.4%
higher than two years ago.